Today I was working with one Client who was having some issues with performance . In Sharepoint 2010 . I found a Out of box Feature which helps in monitoring the performance of the site Developer Dashboard.
The Developer Dashboard is an instrumentation framework introduced in Microsoft SharePoint Foundation 2010. Similar in concept to ASP.NET page tracing, it provides diagnostic information that can help a developer or system administrator troubleshoot problems with page components that would otherwise be very difficult to isolate.
For example, a developer can easily introduce extra SPSite or SPWeb objects into his or her code unknowingly or add extraneous SQL Server queries.
In the past, the only way to debug performance problems caused by the extra overhead of these instances in code would be to attach a debugger to the code and monitor SQL Server Profiler traces. With the Developer Dashboard, a developer can identify this type of problem, either programmatically by using the object model or visually by looking at page output.
Although performance issues and resource usage information is available in the Unified Logging Service (ULS) logs, interpreting the raw data can be very time consuming. With the Developer Dashboard, all the related information is correlated, which makes identifying these types of issues much easier.
How to enable Developer Dashboard and how to use this?
Enable / Disable over stsadm:
stsadm -o getproperty -pn developer-dashboard
stsadm –o setproperty –pn developer-dashboard –pv “On”
Enable / Disable over powershell
Turn On: for onDemain Mode
$service = [Microsoft.SharePoint.Administration.SPWebService]::ContentService
$addsetting =$service.DeveloperDashboardSettings
$addsetting.DisplayLevel = [Microsoft.SharePoint.Administration.SPDeveloperDashboardLevel]::OnDemand
$addsetting.Update()
Turn On
$service = [Microsoft.SharePoint.Administration.SPWebService]::ContentService
$addsetting =$service.DeveloperDashboardSettings
$addsetting.DisplayLevel = [Microsoft.SharePoint.Administration.SPDeveloperDashboardLevel]::On
$addsetting.Update()
Turn Off
$service = [Microsoft.SharePoint.Administration.SPWebService]::ContentService
$addsetting =$service.DeveloperDashboardSettings
$addsetting.DisplayLevel = [Microsoft.SharePoint.Administration.SPDeveloperDashboardLevel]::Off
$addsetting.Update()
On – Displays the output all the time at the end of the page content
Off – Switch off Developer Dashboard and nothing is rendered
OnDemand – Displays a DeveloperDashboard icon to make dashboard output visible if needed.
In ON Demand - you will see a icon on the top right hand side corner of the site . as Shown below .
also you will see the following details when you click on the icon .
How to use the Developer Dashboard?
Developer dashboard is designed to find performance bottleneck during the page load.
To get an overview about the whole page load performance take a look in the upper right side on category “web server”. On my test environment the total time of page rendering is 3801.71 milli seconds.
At the left side you will see the ASP.NET rendering process of all involved controls with their time to render. Here is makes sense to focus only on long running controls.
In this case the longest operation is GetWebPartPageContent (1815.92 ms)
Because sharepoint controls will request data from database, the developer dashboard lists also corresponding sql requests with their execution time.
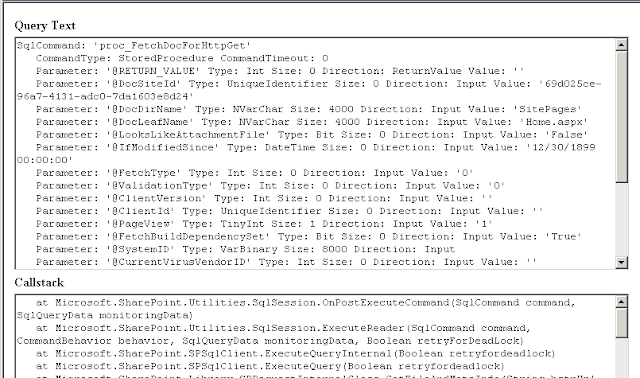
If you click on the sql command than a popup windows display more details. The long running sql request on my test environment is “Declare @…”
During this request i see the complete SQL query and the corresponding call stack to identify the correct control. Additionally at the end we see the IO Stats in case of a slow running SQL server based on too many IO-operations.
One additional category exist for webparts to identify the slow running ones. In this case the ListView-Webaprt of the “Shared Document Library” is the slowest one.
Hope This Post helps administrators on resolving Performance issues .
Reference sites- http://msdn.microsoft.com/en-us/library/ff512745(v=office.14).aspx
http://blogs.technet.com/b/patrick_heyde/archive/2009/11/16/sharepoint-2010-enable-using-developer-dashboard.aspx


